 Log keluar
Revisit our classics (Part 2)
")
Let's talk about hockey strategies!
As announced recently in the French version of the PPM Magazine, I plan to validate which strategy matchup is profitable in the long run in hockey. Of course, we are all aware that some strategies are better than other against a particular style of play. You can find a lot of info on this topic in the PPM Magazine itself. You can learn even more from a simple search on Google. But, are these conclusions valid since PPM offers the option of changing the style of play on a per period basis? That's the main question behind this second article.
FYI, in my first article (in French), a couple of metrics have been set. The most interesting one states that the home team scores, on average, 0.91 more goals per game than the away team. It is a home ice advantage of 30%. Not bad.
Of course, I won't simply publish such simple numbers and basic mathematic formulas every time. I go quite deep in this second article. Power on your calculator and take a deep breath, we are stepping into advanced statistical analysis!
Seriously, there is a lot of number crushing behind the scene. But you won't see it. The most important thing to know is that I've tried to keep the most extreme data out of my analysis. The notes following the table with the results are exactly about that. I recommend you take a minute to ready them entirely. It could answer some of your questions and help you figure out what the numbers really mean.
Another point to keep in mind is that I can't redo the exact same work as my predecessors. Now, style of play is set independently for each period. I'm unable to match directly a style of play to a chance of win. You can use up to three different strategies for a win... or a loss! So I break the model and build a brand new one. This time, I choose to look at the difference in goal scored vs goal allowed for each matchup of style of play for every period played. It won't give you a percentage of win. All you get is the difference of goals you can expect from a specific matchup. Of course, with more goal scored than your opponent, your chance of win is improved... but you have to figure it out yourself.
So, how have I done it? Simple. First, from the season 19, I've collected 4806 game results from the I.1 leagues of the best countries in the PPM universe. I've then removed all the games where the difference between team strength was too big. I've thus trimmed down the list to a mere 3625 game results. It is important to note that no restriction has been applied regarding the score difference, nor the game importance. Next, for clarity, I applied a correction to the original numbers found to balance the 0.91 goals per game corresponding to the home ice advantage (PM me if interested to know how I've done it). Finally, I've added some magical stuff and stir the mix.
What comes up is this table:
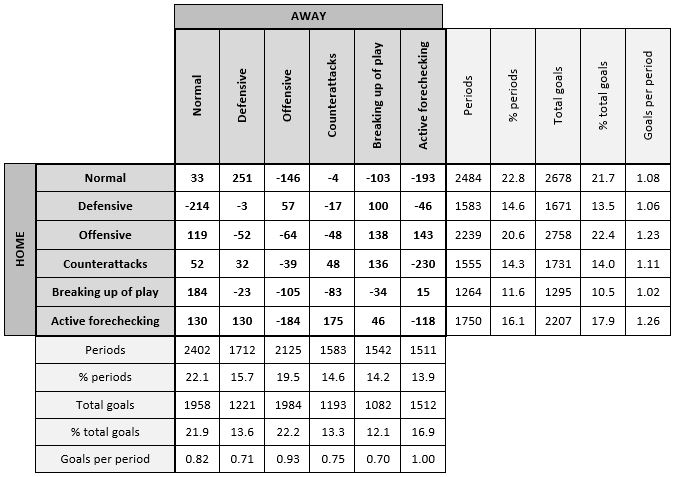
Notes:
- This table is based on 3625 games played through season 19.
- An adjustment has been made to remove the home ice advantage (0.91 goals per game)
- The number in each cell is calculated as "goal for" (home team) minus "goal against" (away team) for each period played with this exact matchup of style of play.
- I evaluate the error margin to be around +/- 50 goals. Thus, it is probably better to take a step back and use this table as a general guideline of the best strategy to use than a precise comparison between each one.
- The stats correction applied to remove the home ice advantage isn't perfect for sure. Active forechecking vs active forechecking doesn't look good enough for me.
- Overtime period isn't computed in this table.
- Goals per period are a bit lower than expected. It's normal because I have rejected around 1200 games where teams had a big difference in strength, thus removing games with a lot of goals scored for one side or the other.
- The period and goal statistics include the home ice advantage. It is why goals per game are higher on the line (home) than on the column (away).
Now, it's time to learn how to use it. Let say we choose the cell where the home team plays normal and the away team is playing defensive. What we found in this cell is the number 251. Since it is over zero, it means the normal strategy (for home team) is good against defensive style of play (for away team). By how much? Well, the higher the number the better. In this case, 251 means that over the span of 2484 periods (you can find this number farther down the line), the home team will score 251 more goals than his opponent. If you choose a negative number, let say the -184 you can find in the cell for active forechecking vs offensive, it means a team will score 184 goals less than his opponent over 1750 periods. It's as simple as that.
Beside this basic table, I've added some info about the number of periods and goals scored for each style of play (lines are for home team, columns are for away teams) and a ratio of the goal per period you can expect for each strategy.
So, does it go in the same direction as the old studies? Of course, yes. But things are not as straightforward as expected. Some styles are better all-around strategies, while others have more success against a single style of play. I'll let you draw your own conclusions.
I'll look at different statistics in my next article. The style of play matchup effect over PIM drawn and PP success vs PP and PK strategies are two things that comes up to my mind.
So, any comment?
Kongsi di Facebook Kongsi di Twitter Kongsi di MySpace
Editor
Hubungan - Syarat bisnes - Dasar privasi - Cookies settings - Peta portal
Mengiklan di PowerPlay Manager - Jadilah rakan kongsi kami!
Rakan kongsi: www.tennismania.com - www.biathlonmania.com - www.skijumpmania3.com - www.athleticsmania.com - www.wintersportsmania.com - www.summersportsmania.com
[all: 70ms / php: 31ms / db: 39ms ]
Web server: WB2