 Log out
A Systematic Collection of Career Longevity and Age Data

I conducted a new project recently, one to address a few questions I had pertaining to the odds that 15 year old elite youngsters would retain their beloved 6/6 CL and become 22 5/6 legends. So, rather than look through a bunch of players myself (which would be prone to human error and non-random sampling) I did what any trained physicist would do - let a computer do all the work! I crafted a program that would skim through players starting at a player ID indicative of day 1 players through to modern day 15 year olds. It would sample at a given interval and would ignore players who were not on a team (they drop in C/L but don't age). And with that, I left it to skim the pages of PPM during the quiet time for the servers.
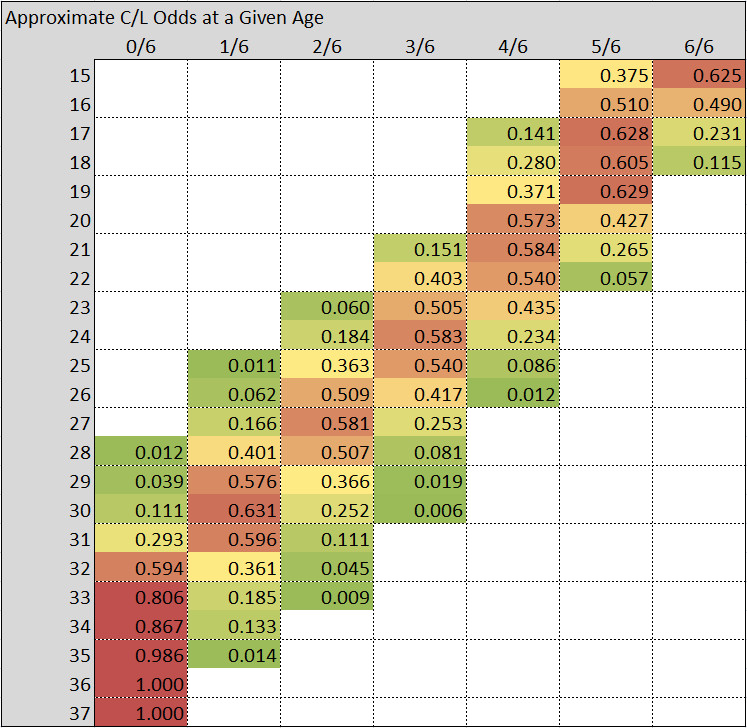
First I started with small data sets to make it easy to perform consistency checks. Once they all passed I moved to larger and larger data sets before wrapping up the investigation with age and CL data on 7233 players. I then tabulated them based on their age and CL. This data can be seen below in the table where the numbers correspond to the percentage of players at a given CL for that age. For example, for 18 year old players, 11.5% were 18 6/6, 60.5% were 18 5/6 and 28.0% were 18 4/6. The upper zig-zag edge corresponds to the worst CL path while the lower zig-zag edge corresponds to the best CL path.
We can extract even more from this as well. Looking down the right edge of each step (i.e. 6/6 from 15 to 18, 5/6 from 19 to 22 etc.) you can see the change in percentage at each age which gives clues to C/L drop odds. Sticking at a given CL is indicated by moving straight down. Dropping in CL is indicated by moving down and left. One must be mindful of the various scenarios. For example, this is only trivial when there are blank cells to the right of the cell being investigated. For example, a 20 5/6 player has 62% odds to stick to 21 5/6 (0.265/0.427). However, the calculation is more difficult for a 21 4/6 player because the 22 4/6 value includes players dropping in CL from 21 5/6 in addition to 22 3/6 coming from 21 4/6. One can extract approximate odds from this, they just need to be mindful of all scenarios.
Lastly, this data is most accurate for younger-aged players due to better statistics. Once you start looking at the 30+ players, they are so few that the statistics are poor and should only be relied on as a VERY rough approximation.
Some key stats I pre-calculated and can be found immediately below:
Odds a 15 6/6 will make it to 18 6/6: 18.4%
Odds a 15 6/6 will make it to 22 5/6: 9.1%
Odds a 15 6/6 will make it to 26 4/6: 1.9%
Odds a 15 6/6 will drop to 16 5/6: 21.6%
Odds a 15 5/6 will drop to 17 4:6: 37.6%
Happy PPMing,
-Scott
Share on Facebook Share on Twitter Share on MySpace
Editors
Contact - Terms of Service - Privacy Policy - Cookies settings - Site map
Advertising on PowerPlay Manager - Become our partner!
Partners: www.tennismania.com - www.biathlonmania.com - www.skijumpmania3.com
[all: 37ms / php: 23ms / db: 15ms ]
Web server: WB1